In Germany, every day approximately 10,000 people are admitted to the hospital with a suspected myocardial infarction. Although this diagnosis will be confirmed in only 8% of the cases, acute myocardial infarction is still one of the most common causes of death.
The highest chance to survive an infarction is a speedy diagnosis so appropriate treatment can be initiated. “Cardiogoniometry” (CGM) is a new method with which a hidden infarction can be detected within seconds.
Swiss physician Dr. Ernst Sanz developed this diagnosis based on vectorcardiography, which is the basis of enverdis’ CARDIOLOGIC EXPLORER. enverdis has developed this device, during years of extensive research, which offers an immediate and straight forward application.
Cardiogoniometry Is a New Stress-Free, Non-Invasive Diagnostic Procedure
The electrical activity of the heart is displayed three-dimensionally within 12 seconds using five electrodes. The test takes place in a resting position. There is no requirement for a stress ECG . The computer instantly interprets the data and the readings are available immediately following the test. Therefore, the patient and the medical professional receive feedback without delay, enabling the doctor to spot an infarction right away.
CGM provides a three-dimensional display of the heart’s activity which is more precise than the classic ECG.
In addition, impaired circulation of the heart, often the precursor of an infarction, can be diagnosed completely stress-free.
The Original Vectorcardiography
Since the introduction of electrocardiography, the term “electrical axis” has been used. Within a normal cardiac cycle excitation, during the peak of the R wave, a comparatively strong electrical force becomes evident, which is directed toward the cardiac apex. This can be marked in “Einthoven’s Triangle” as the “electrical axis of the heart” – or “electrical axis of the R wave” to be more precise. The three characteristics: size (length), direction (position within coordinate system), and polarity, mark the physical definition “vector”.
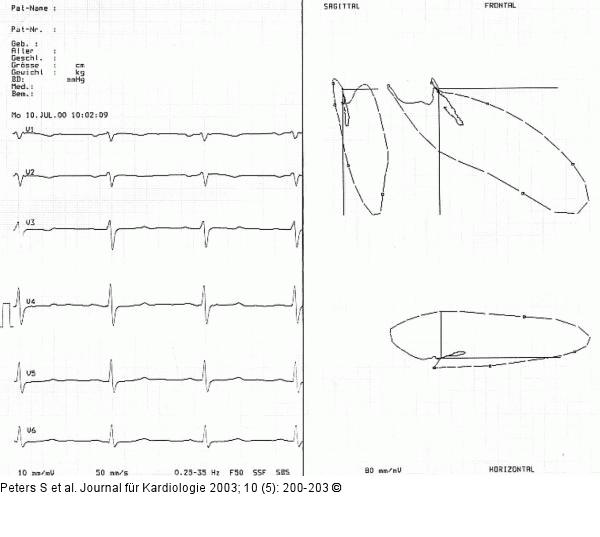 The chronological resultant force of the bio-electrical forces (momentum vectors) can be marked in the Einthoven’s Triangle with arrows, connecting the arrow tips. Thereby, a coherent ansiform line emerges, which represents the vectorcardiogram (VCG). This is labelled the geometric position of the endpoints of the individual current vectors on the frontal-plane. The vectorcardiogram specifies in which direction and at what intensity the activation takes place at any given point.
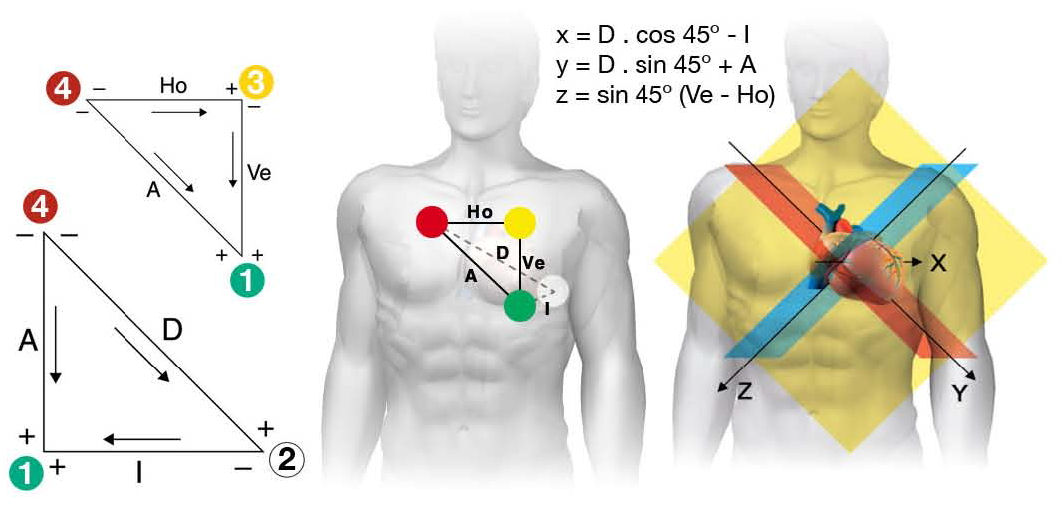
Electrode Diagram and Orthogonal Leads
Mechanical heart activities are based on the conduction of electrical impulses resulting in measurable potentials. These potentials are captured and converted into digital values using bipolar leads (A, D, and Ve). For data recording, in addition to the ground electrode, only four thoracic electrodes are required, positioned in a predefined geometric configuration. The particular electrode positioning provides a three-dimensional reading and spatial display of the cardiac potentials over a specific period of time.